
Force Browser CACHE Reload to Update Images
 Ctrl-F5
 F5
F5

 -R
-R
U.S. CoViD-19
The expanding bureaucracy is increasing to meet the needs of the expanding bureaucracy.
- Oscar Wilde
Updated: 17:40PST - 20 April 2020
| • pneumonia | $5,000 |
| • CoViD-19 | $13,000 |
| ⇒ w ventilator | $39,000 |
U.S. Daily Additions
20-Apr-20 - MA reported Identical Data to the previous day.
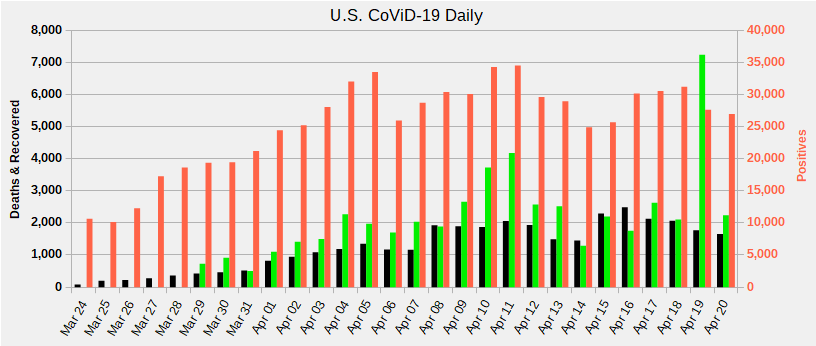
 Mortality
|
 Recovered
|
 Positive
|
U.S. CoViD-19 Weekly Positive to Tested Ratio
 2 Weeks
|
 1 Week
|
 Current
|
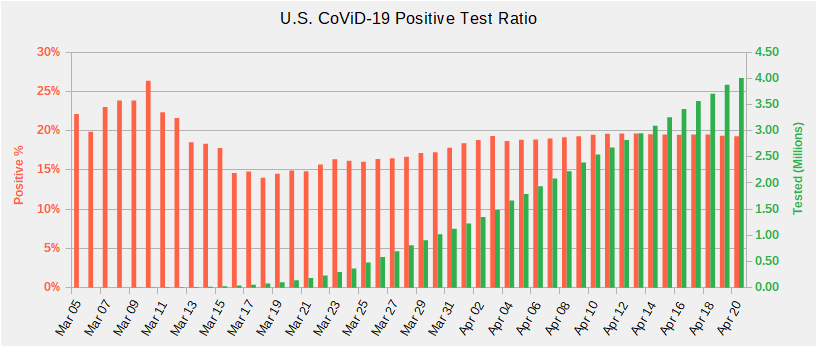
U.S. CoViD-19 Daily Positive to Tested Ratio
from ⇒ Can a Negative COVID-19 Test Be Trusted?
|
Positive %
|
 Number Tested
|
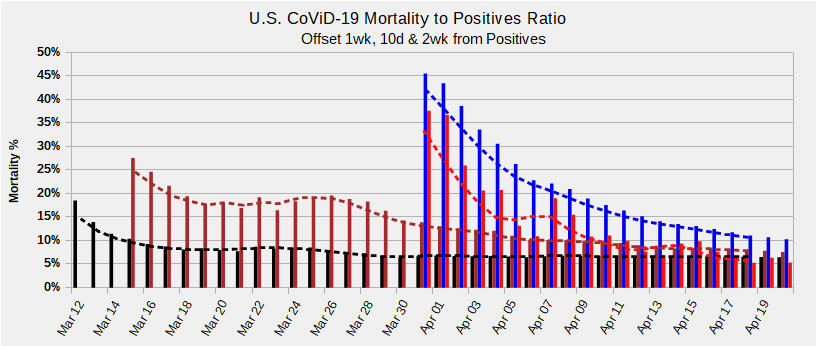
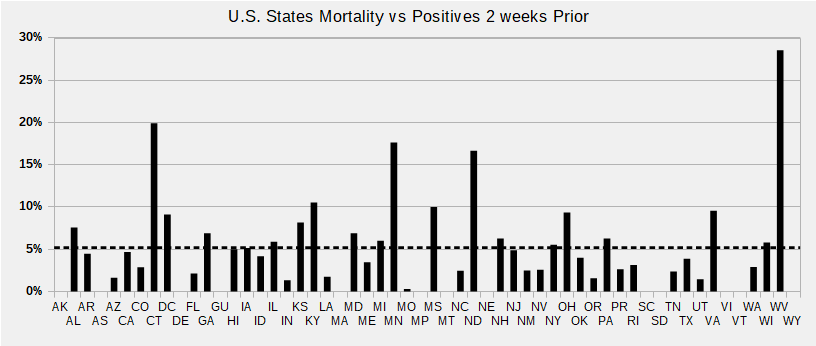
U.S. CoViD-19 Mortality to Positive Test Ratio
U.S. mortality as Percentage of positives, offset by the period indicated. High initial percentages are due to testing only the symptomatic. WHO estimates peak mortality occurs 14 days after the onset of severe symptoms. US mortality rates will be higher initially due to delayed testing.
After 4 weeks, 1 week mortality total is level at ≈6% of positive totals 10 day is level at ≈10%. The NET mortality over the NET positives 2 weeks prior is ≈11%. Poor reporting consistency undoubtedly contributes to the volatility.
Mortality figures could be considerably lower given that test detection ratio is not 100% accurate. The lack of temporal data for probable infection and becoming symptomatic skew the mortality and recovery ratios.
|
Mortality 1 wk %
|
 Mortality 10 days %
|
 Mortality 2 wk %
|
 Mortality 2 wk NET %
|
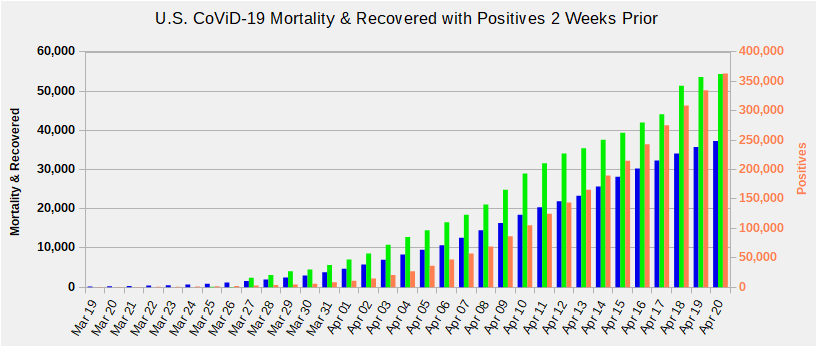
U.S. CoViD-19 Mortality & Positives Two Weeks Prior
Until positives flatten, mortality won't for another couple of weeks. If positives continue to climb unabated, mortality may climb faster due to overwhelmed care facilities.
Current U.S. Recovery Rate holding around ≈150% of Mortality as more states report better data. Overall U.S. Recovery climbed to ≈170%.
Global Recovery Rate is ≈379%, but extreme vagaries in reporting methods make the number essentially meaningless.
|
Mortality
|
Recovered
|
 Positives 2 weeks prior
|
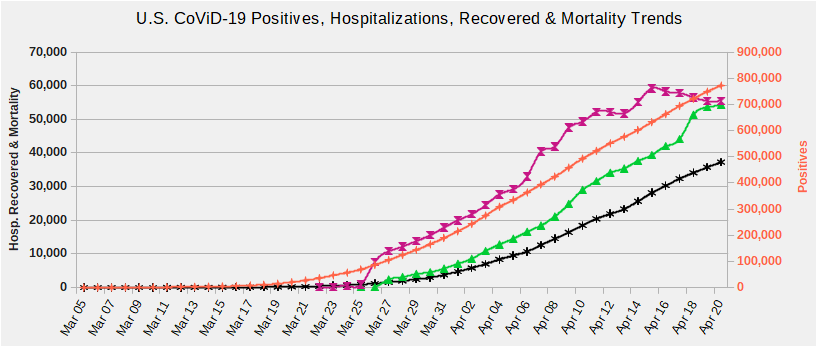
U.S. CoViD-19 Hospitalization, Mortality & Positives Trends
Some states are not reporting current hospitalizations.
|
Recovered
|
 Currently Hospitalized
|
Mortality
|
Positives
|
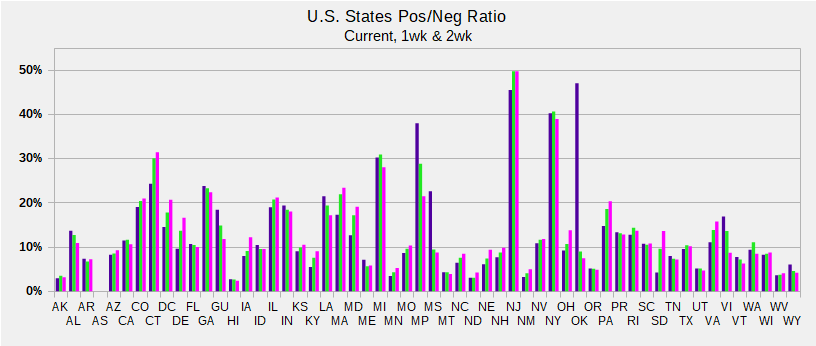
U.S. CoViD-19 Population Percentages
States with high percentage of Tested Positives likely are not testing any but those with symptoms.
Mortality % is deaths divided by Positives and only for States and Territories with Tested.
ALL is Total U.S. population. Positive, and Mortality are Left Y axis, % of Populations Tested on Right Y axis.
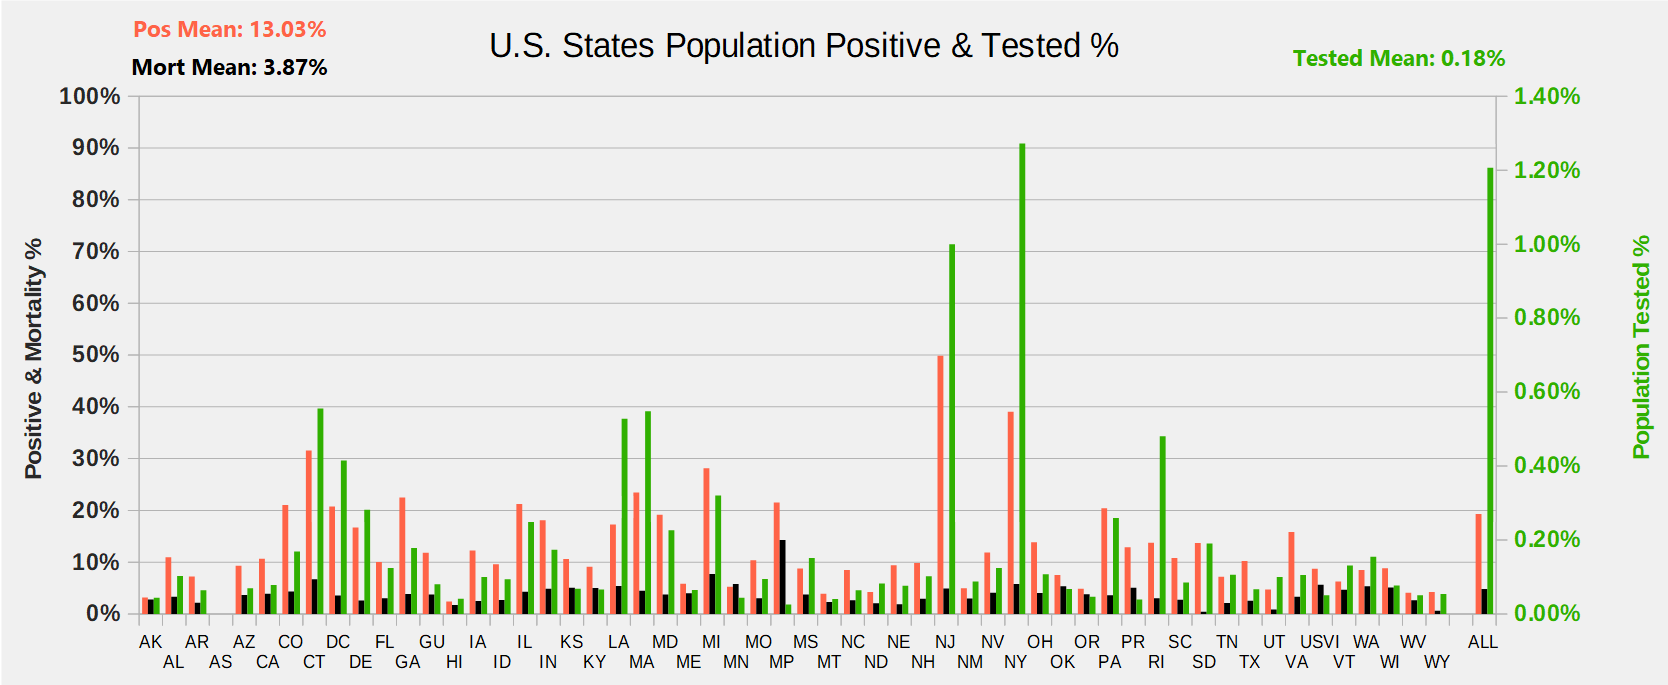 Click Graph for a larger image
|
Positve %
|
Mortality %
|
Tested %
|
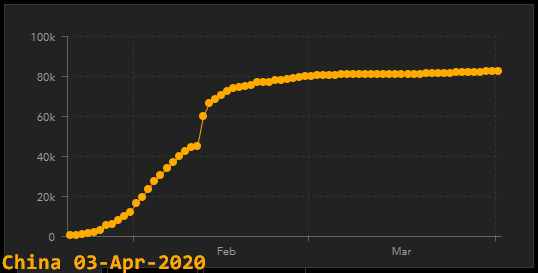
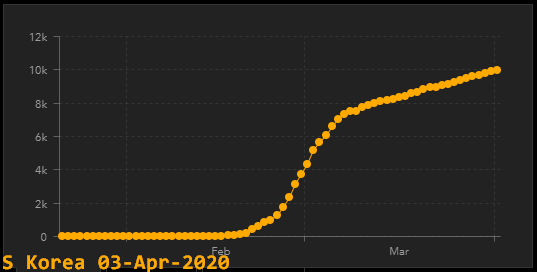
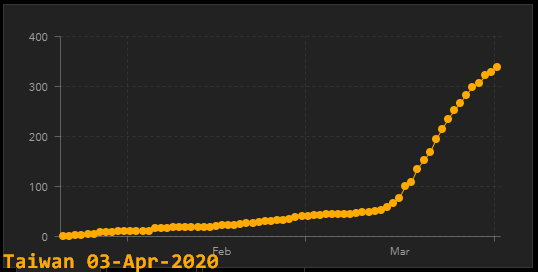
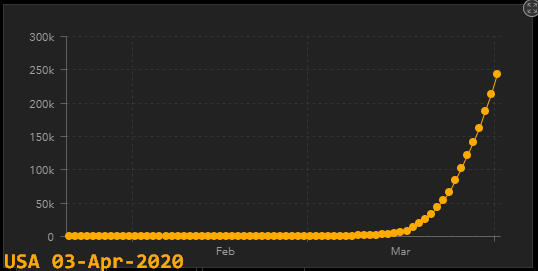
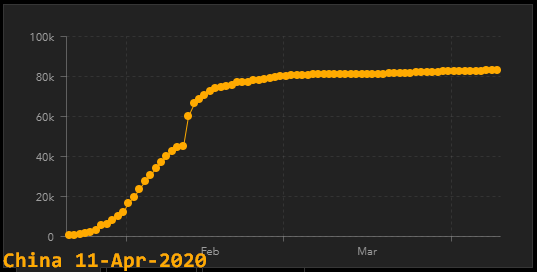
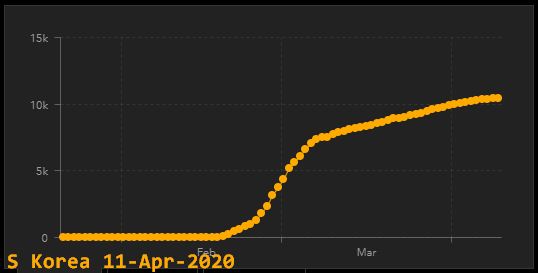
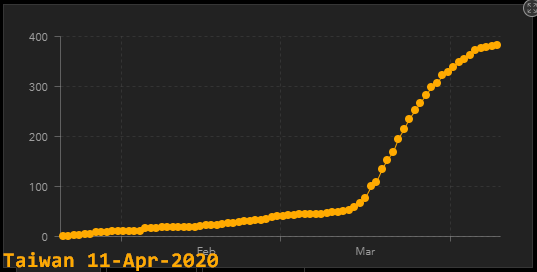
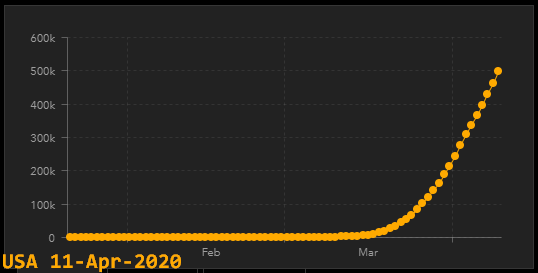
The Curves
⇒ from Estimates Show Wuhan Death Rate Far Higher Than China’s Official Reports - 30 Mar 2020
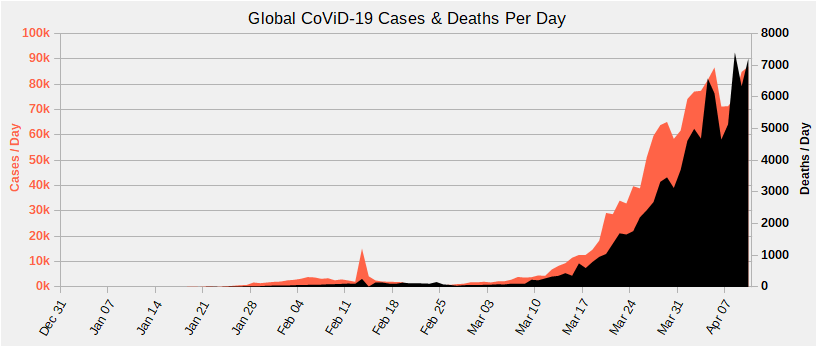
from Johns Hopkins Coronavirus Resource
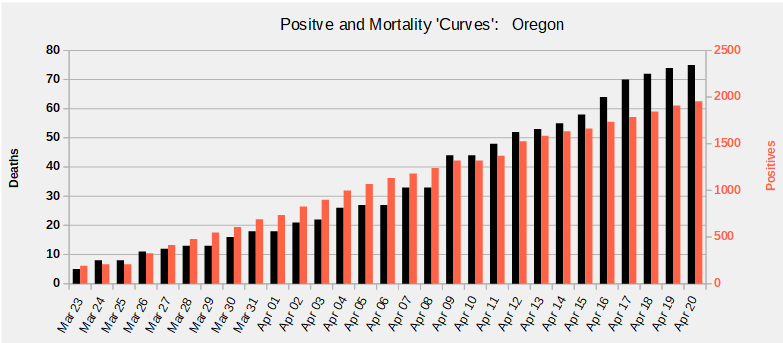
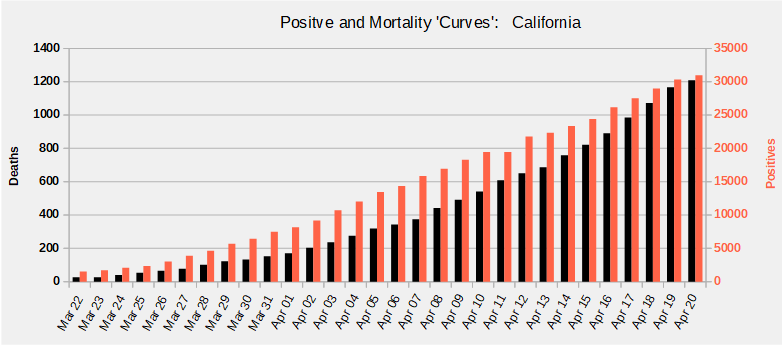
The CoViD-19 Buzz Phrase assuredly has to be 'Flatten the Curve'. Curves from Johns Hopkins Coronavirus Resource.
China continues its charade. NO other country on earth has a similar curve, giving rise to a strong belief of ChiCom mendacity.
South Korea's is the next best and it is nowhere near flattened, only flattening. Taiwan's is again flattening: How Taiwan Contained COVID-19: Early Action, Technology & Millions of Face Masks
The US is near vertical and it will be a long haul to flatten it.
|

|
|

|
| Oregon | Washington | California | New York |
Notice the contrast between New York with mass transit, an epidemic's best friend, and California's private transportation. Of course there are other factors, but commuters coming into NYC, riding the subway and then returning back to the 'burbs everyday surely contributed to the 10x ratio between there and California, 20x based on populations.
While the Positives are increasing, the Curve is not Flattening.
U.S. Response
“Coronaviruses are well known to undergo genetic recombination, which may lead to new genotypes and outbreaks. The presence of a large reservoir of SARS-CoV-like viruses in horseshoe bats, together with the culture of eating exotic mammals in southern China, is a time bomb.”
⇒ from Severe Acute Respiratory Syndrome Coronavirus as an Agent of Emerging and Reemerging Infection published in 2007

The true scale of China's medical stockpile is revealed
The Grim Costs Of Total Lockdowns & How deadly is the coronavirus? It’s still far from clear.
WHO and U.S. response was very slow. The CDC forbade testing while it developed its own tests in spite of the success of tests in Germany, Taiwan and Korea. The first cases in the U.S. and S. Korea were detected about the same time. As of March 17, 1 in 4300 in the U.S. had been tested vs. 1 in 43 for S. Korea. March 20, the CDC shut down efforts to rapidly make available at-home testing kits. See Bunglers below.
Unbelievably, the U.S. Surgeon General still advises against wearing masks because it reduces the numbers available for health care workers. Wearing masks reduces expelled pathogens! Wearing a mask reduces transmission as well as contraction. Had everyone masked up, the U.S. would have dramatically reduced CoViD-19. Even the 6 foot [2m] recommendation is flawed as a sneeze can propel pathogens 20 feet [6m].
“Since the CDC provides no scientific evidence for its statement that masks worn by the public "are not effective", here we review the scientific support for protection conferred by surgical masks.”
…
“The official recommendation by CDC, FDA and others that masks worn by the non-health-care professionals are ineffective is incorrect at three levels: In the logic, in the mechanics of transmission, and in the biology of viral entry”
⇒ from COVID-19: WHY WE SHOULD ALL WEAR MASKS — THERE IS NEW SCIENTIFIC RATIONALE
Millions of tests have been deployed in Asia and Europe while the U.S. bureaucracy dallies. March 25, we received a post card from the CDC advising us what everyone already knows!
Media coverage is appalling covering the range from Apocalypse Now to Pollyanna. A March 23 Issues & Insights editorial reports the CDC symptom onset numbers as good news when those numbers represent only too soon to tell. See The Curves below.
State Health offices have vastly different protocols. They change their positions on what they test and when they report further adding to the chaos. See Bunglers below.
Useful Information
⇒ from Official COVID-19 Numbers Represent Just 6% of Total Infections, a New Analysis Suggests
⇒ from Three graphs that show a global slowdown in COVID-19 deaths
⇒ from EARLY OBSERVATIONS ON THE PANDEMIC AND POPULATION DENSITY
Source: Scripps Research Institute
Summary: An analysis of public genome sequence data from SARS-CoV-2 and related viruses found no evidence that the virus was made in a laboratory or otherwise engineered. COVID-19 coronavirus epidemic has a natural origin
World O Meters has excellent CoViD-19 pages. World O Meters Age, Sex, Existing Conditions of COVID-19 statistics.
This pre-CoViD-19 study found that medical masks are equally effective for prevention of viral respiratory illnesses. MedLine introduced Antiviral Face Mask that Inactivates 99.99% or Tested Flu Viruses in 2012! Needless to say masks of this type are nowhere to be found.
An N95 mask is effective to ≈0.3 microns. The CoViD-19 virus is about 120nM or about 33% of the size blocked by an N95. Some medical researchers have reported that CoViD-19 pathogens can be expelled as a single entity.
However: Think of it like throwing a handful of sand at a screen door. All the particles of sand will fit through the individual holes in the screen but only a very, very few will pass. In a mask, the holes are a tiny fraction of the total area, whereas door screen is mostly open, so the catch ratio is much higher. A typical multi-layer mask further reduces the hazard.
ANY mask is better than none! All worn masks should be considered as contaminated. Properly dispose or make sterile for reuse.
Bunglers
« While this is a serious public health threat, CDC continues to believe the immediate risk to the U.S. general public is low at this time. » ⇒ from CDC confirms additional cases of 2019 Novel Coronavirus in United States - 26 Jan 26 2020
« I WANT TO SAY RIGHT NOW CDC’S RECOMMENDATIONS AND THE POLICIES WE ARE FOLLOWING ACROSS THE BOARD IS TO TEST PEOPLE WITH THE HISTORY OF EXPOSURE WHO ARE SHOWING SYMPTOMS. » ⇒ from Transcript for CDC Media Telebriefing: Update on COVID-19 - 14 Feb 2020
«
In 2016, IRIS found that EtOs start to pose harm to human health at the infinitesimally low level of 100 parts per quadrillion, or approximately 19,000 times lower than the amount of EtO found in the human body.
That’s right: according to the EPA, humans are exposed to sky-high EtO risks just by being alive and producing EtO internally. This isn’t the first time that IRIS has pedaled junk science.
»
⇒ from This EPA Regulation Is Literally Making People Sick
« Take the case of Alex Greninger, a doctor and researcher at the University of Washington, who, according to a report in GQ, submitted his application to create a coronavirus test via email. Then he learned that he also needed to submit a paper copy, and then another version burned to a compact disk or loaded onto a drive and delivered to the FDA's Maryland headquarters. » ⇒ from The Coronavirus Testing Debacle Stems From Decades of Bad FDA Policy
«
The infected passengers flew in a cordoned-off section of the airplane, separated from the other passengers by plastic sheeting, according to the State Department news release. Upon landing in the United States, all of the Diamond Princess passengers entered a 14-day quarantine at either Travis Air Force Base in California or Joint Base San Antonio in Texas. Passengers were not informed until after they landed that they had been flying with people infected with COVID-19, according to the Post.
'I think those people should not have been allowed on the plane,' Vana Mendizabal, 69, a retired nurse from Florida who was on the flight, told the Post. 'They should have been transferred to medical facilities in Japan. We feel we were re-exposed. We were very upset about that.'
»
⇒ from Coronavirus-stricken cruise ship passengers returned to US against CDC advice
«When coronavirus emerged, the company spent 23 days doing a high-throughput screen of their antibody library and produced several new antibodies based on the novel virus. “We were able to quickly iterate what we do in other viruses and apply our tech to SARS-CoV-2,” says Bosch.
E25Bio now has all the components of their test ready for coronavirus diagnosis, but no access to the virus to test it. “The scientific community in Boston had not been cleared by the Department of Public Health in Massachusetts to open a vial of virus within secure facilities,” says Bosch. She has been waiting two months for access to the virus, despite running a laboratory that already works with zika, dengue, and West Nile virus, among others. The company’s manufacturer said they can shift from dengue to coronavirus and produce 100,000 coronavirus tests per day, says Bosch—once the test is ready. The Massachusetts Department of Public Health Bureau of Infectious Disease and Laboratory Sciences did not immediately respond to a request for comment.»
⇒ from Wanted: Rapid, Portable Tests for Coronavirus
«When the new coronavirus appeared, the Centers for Disease Control and Prevention made its own tests and insisted that people only use those CDC tests. But the CDC test often gave inaccurate results. Some early versions of the test couldn't distinguish between the new coronavirus and water.
Private companies might have offered better tests, and more of them, but that wasn't allowed. The World Health Organization even released information on how to make such tests, but our government still said no. Instead, all tests must go through the government's cumbersome approval process. That takes months. Or years.
Hundreds of labs had the ability to test for the virus, but they weren't allowed to test.
»
⇒ from Government Red Tape Delays the COVID-19 Response
Data is revised, sometimes several weeks later, which accounts for day to day changes. Some data is not reported timely, accounting for some large day to day changes. Hopefully, later corrections will smooth out the data.